App Store
App Store
7天免费试用
暂无评论

Graphs & Charts by Plumspace
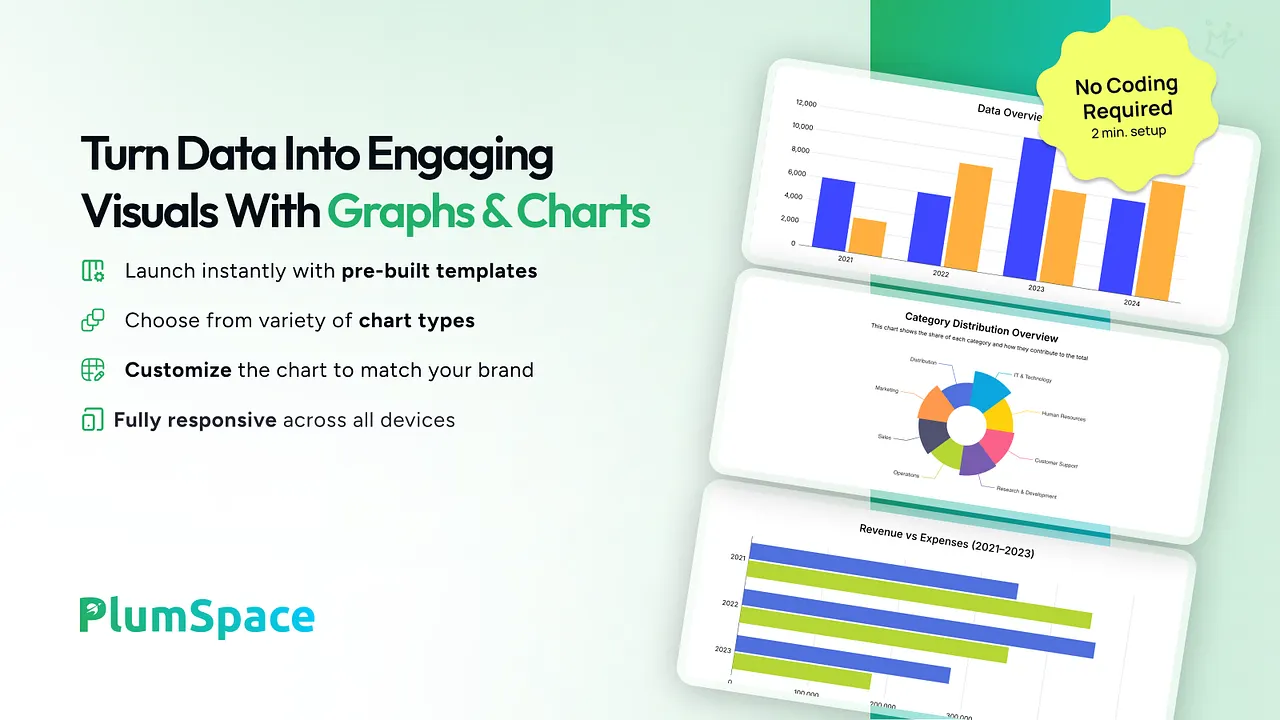
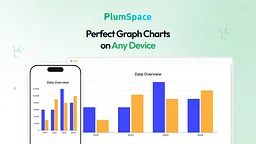
Turn raw store data into engaging visuals that inspire trust and drive sales
Graphs & Charts by Plumspace
7天免费试用
Turn raw store data into engaging visuals that inspire trust and drive sales
暂无评论


关于Graphs & Charts by Plumspace
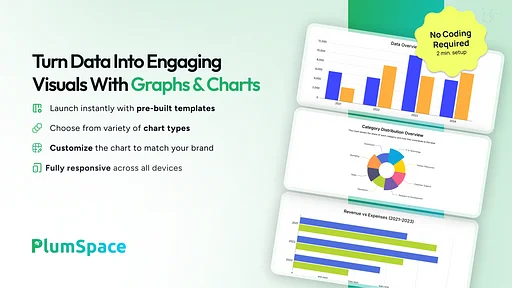
Turn Data into Insights that Drive Conversions
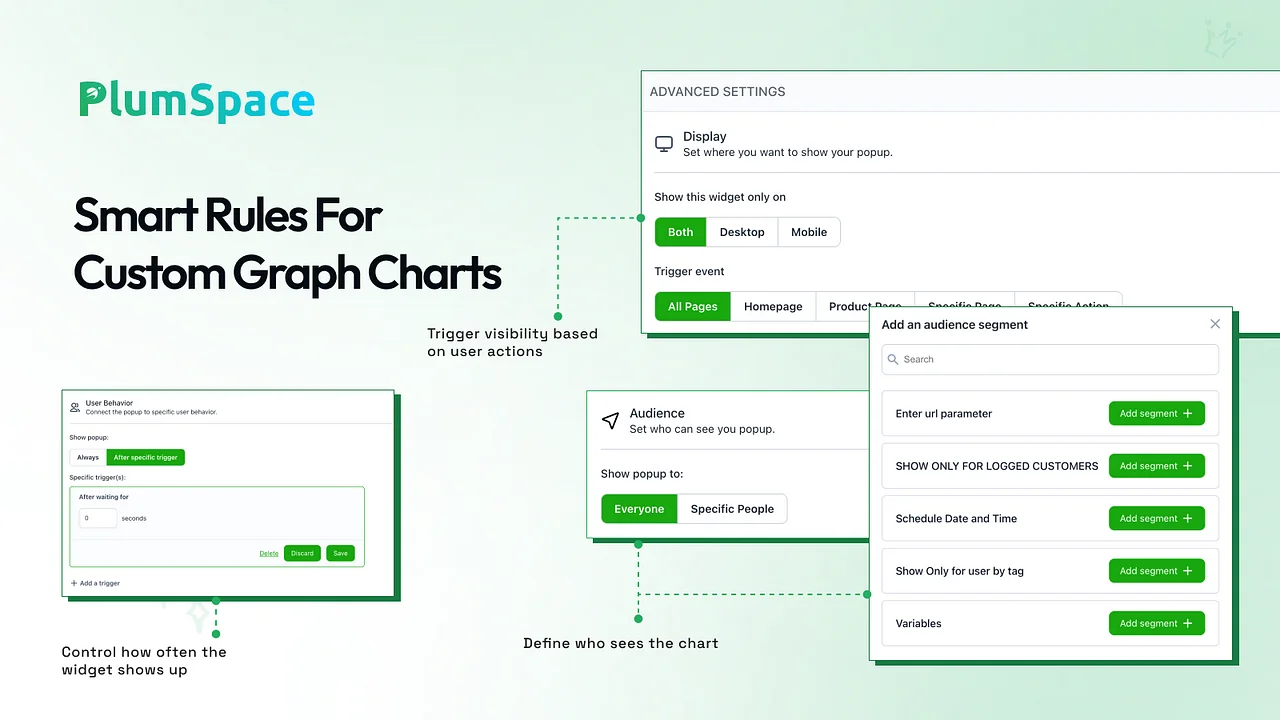
Graphs & Charts helps you communicate data visually — making complex numbers easy to understand and engaging to look at. From product comparisons to sales progress, you can create beautiful, responsive charts that blend seamlessly with your store design. Choose from 16 chart types and customize every detail to fit your brand’s aesthetic and goals. Perfect for showcasing transparency, tracking performance, or adding visual storytelling to your content.
Key Features:
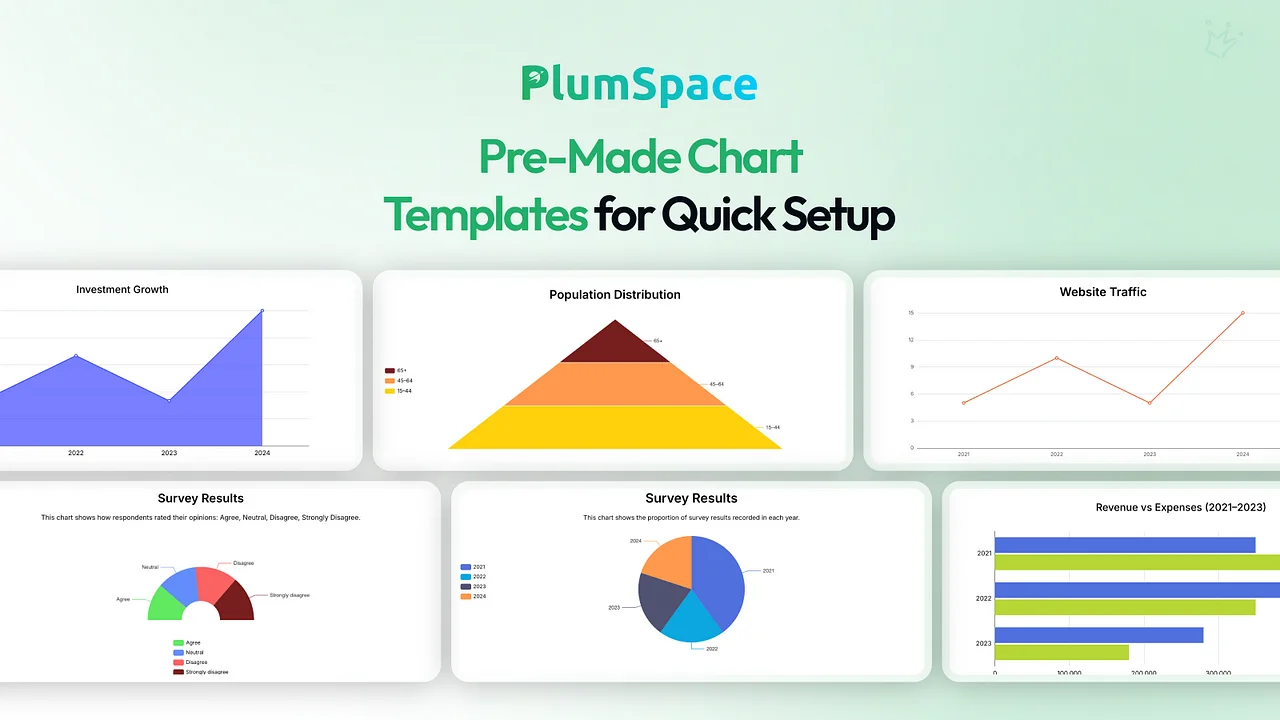
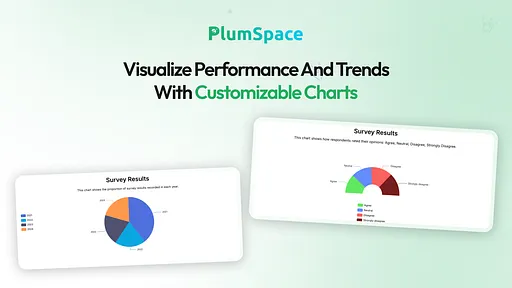
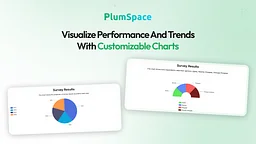
- 16 Chart Types– Create bar, pie, line, donut, radar, and interactive charts to visualize any data.
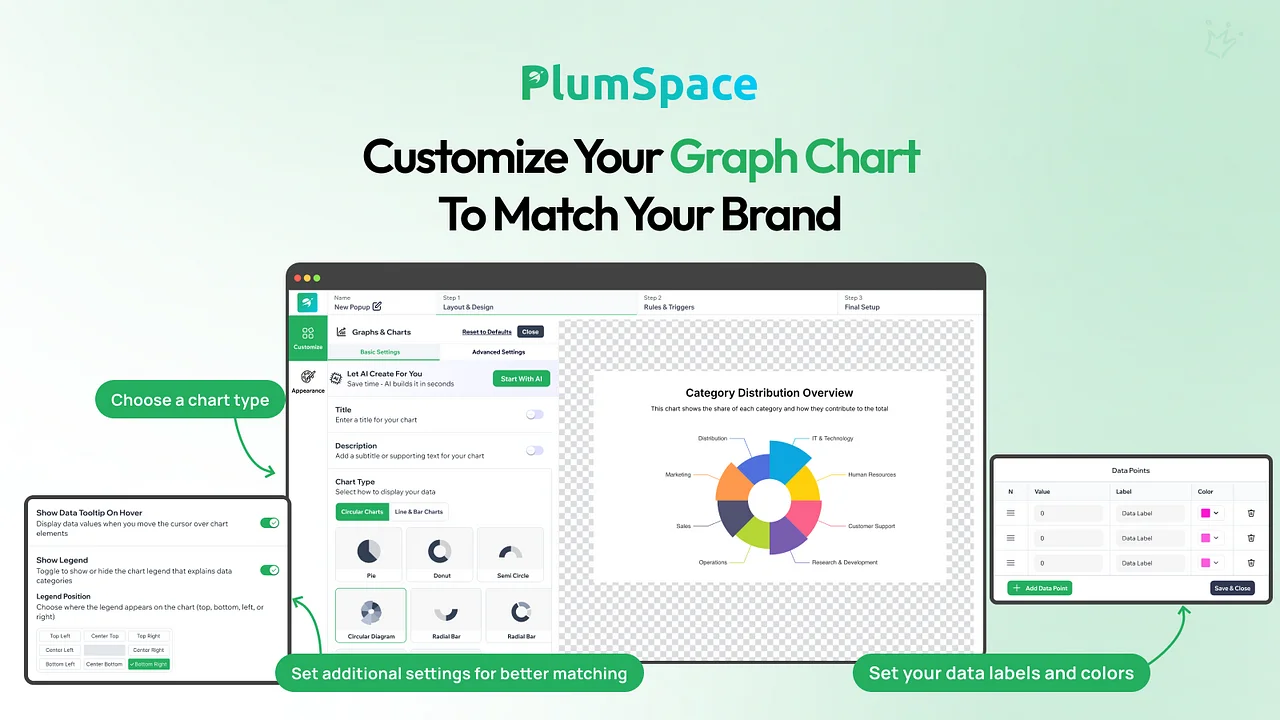
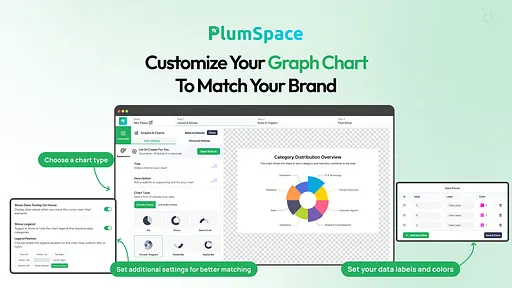
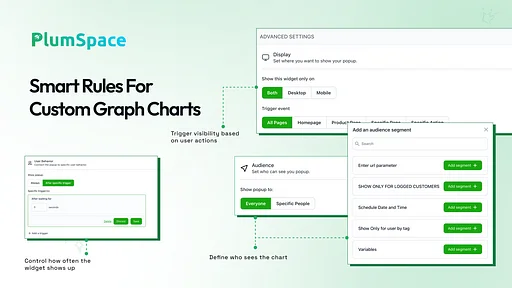
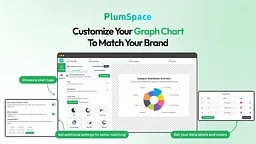
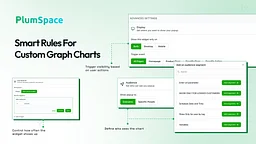
- Full Customization – Adjust colors, fonts, and layouts to match your store’s visual identity.
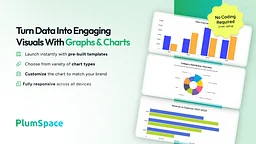
- Professional Templates – Launch stunning charts instantly with pre-built design presets.
- Embed Anywhere – Add charts to product pages, blogs, landing pages, or promotional sections.
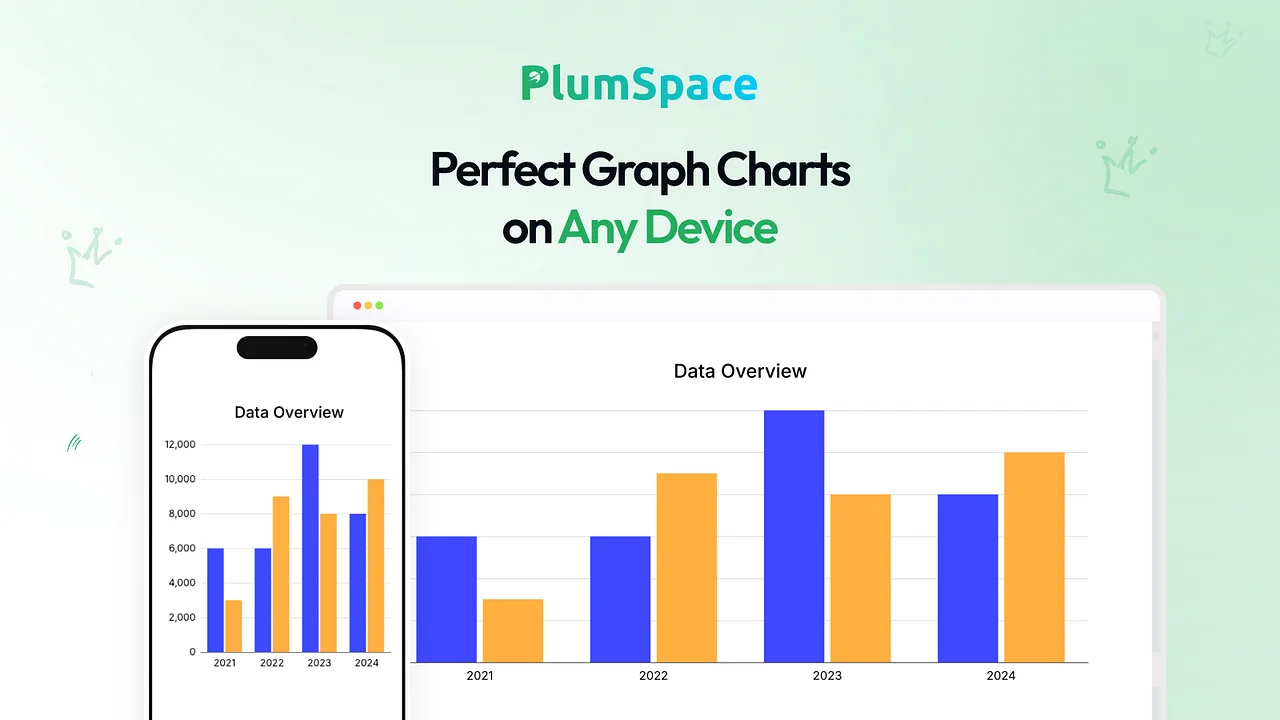
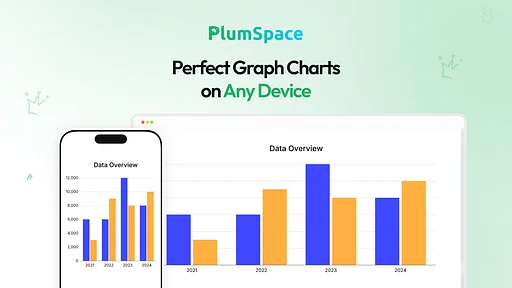
- Fully Responsive – All charts adapt perfectly across desktop, tablet, and mobile devices.
How It Benefits Your Business
- Present data in ways that persuade customers and support buying decisions.
- Build credibility by sharing key metrics or performance results visually.
- Keep your audience interested with interactive, dynamic visuals.
- Auto-sync updates mean your charts are always fresh and accurate.
Install Graphs & Charts today to elevate your storytelling, visualize your success, and turn your data into a powerful sales tool.
价格
Basic
$6.00/ 月
$6.00 up to $24.00 based on store orders
Up to 10 Shoplazza orders per month
Unlimited widgets
Pre-made templates
Fully customizable widgets
No coding
Live chat and support emails
7天免费试用
Pro
$12.00/ 月
$6.00 up to $24.00 based on store orders
Up to 100 Shoplazza orders per month
Unlimited widgets
Pre-made templates
Fully customizable widgets
No coding
Live chat and support emails
7天免费试用
Advanced
$24.00/ 月
$6.00 up to $24.00 based on store orders
Unlimited orders per month
Unlimited widgets
Pre-made templates
Fully customizable widgets
No coding
Live chat and support emails
7天免费试用
所有费用均以USD结算。 定期费用和基于使用情况的费用每 30 天收取一次。查看所有定价选项
用户评价
0.0
目前还没有评论,留下第一条评论吧!